Thank you for joining us again. We are glad to have you here with us today.
This week we have been working on how to wrangle an overwhelming set of larger-than-life problems into a set of easily workable solutions.
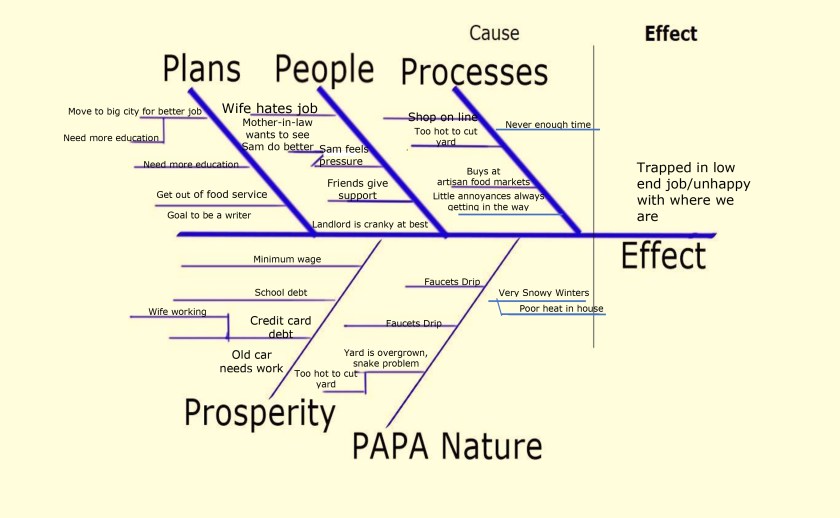
As you seen over the last few weeks, this is absolutely possible. It starts when you admit there are problems, you do an affinity diagram to get an idea of the total landscape concerning the processes. Create a cause-and-effect chart so that you can see the causes that are happening right now and you see the effect you’re having right now. Knowing now the effect that you have and the effect that you want to have, which are probably two different things, you can now look at what causes you might be able to change to make the effect better.
Next thing you want is real data. If you remember, earlier we were working on the home front and as such using some anecdotal information. In business and home efforts, the more data you can gather, the better your efforts are going to be to correct and improve concerns.
In business, we find ways to place measurements on those things we are concerned about. It can be as simple as somebody doing a process and keeping a tic sheet of problems. The measurement could be as elaborate as automated or semi-automated shop floor data collection systems that gather information every time a unit is moved from one location to another, or as critical parts are added. Shop floor data collection system (SFDC) works great for business.
An example of how the SFDC system helped me to find and correct a problem on the assembly line when people from the line started coming to me one day and telling me that there were big problems. They said everything was the moving slow and there were many units that had to be reworked due to poor workmanship and scratched parts.
The first thing I did was pull up the data on the computer. The data showed me that there had only been two items that had to be reworked. One was a screw that was not properly seated, and the other was a cable that was not properly plugged-in. There was no mention of scratches.What worried me though was a line that was supposed to put out 50+ units in an hour, only about 17 units per hour were being completed and packed.
I had been on the line at shift change that morning, and everything looked fine then. That was just three hours ago. I went back out to the production line, and yes it was backed up. I started going station to station to and asking people how things were. In short time, I found out that the quality technician at the end of the assembly line was finding many build problems. The quality technician was trying to make the line look better, so rather than reporting the problems in the SFDC system, was repairing all the problems rather than sending them to rework.
I got with a line supervisor and had the line stop for a quick meeting. I explained everybody why it is important to everyone involved that we use the system correctly and that we actually record all problems and record all repairs. I also explained that the reason for the use of that system was so that I could actually see the problems that were happening on the line. I could quantify them, and then I could change the processes to eliminate the causes of those problems. I also had to explain everybody that when they log such problems they were not getting themselves or anyone else in trouble. They were actually doing what was required and what the engineering department needed to make the processes better and easier for them to use and make everyone’s job easier.
After that, I got better data and was able to design much better processes which allowed for higher quality and easier assembly.
I have also had times where people came in and complained that every other screw was not inserted properly. Going out and doing spot checks on the line, I found out that the shop floor data collection system was correct. Only two screws had been not fully seated, and everything else was fine. A couple people on the line were just having a bad day. I talked with them and was able to let them vent their frustration (which were personal, and not about the build), and then they were able to complete their shift without having the concerns, which really weren’t there to start with. In both cases, without eyes on the line and the shop floor data to show what was real and what was not, as the engineer I would not have been able to make the right calls and build the right processes.
In the first scenario that we looked at wrong data would have led to a poor status quo because the processes would not have changed. In the second scenario, having the correct information allowed us to keep processes that were working, and identify and fix the true concerns.
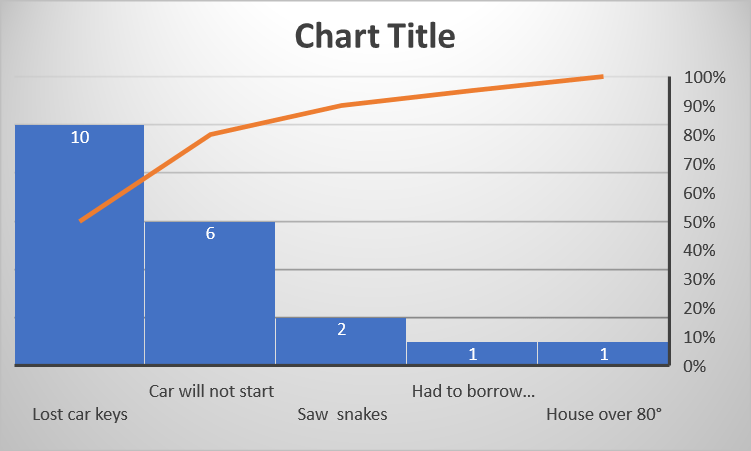
This is why we will also go back and look at the Pareto chart in other uses. I will give you ideas for how it can work at work and how it can work at home.
Before I leave you today, I need to ask a favor. This favor is to help me to better help you. The question is, are these posts on quality and process improvement something you want to learn? Or do you want to learn something else?
I ask you this because I’m taking two courses this week (yes, teachers take a lot of courses.) We are at the part of the course where we are ensuring that the classes we write are classes wanted by the folks who read us. If there’s something else, you would rather learn, please let me know. I would be more than glad to write on those topics also. If you have any thoughts or ideas, please let us know in the comments section on the blog. I will contact you and try to make other subjects happen.
Thank you for reading this today and thank you in advance for your thoughts, ideas, and comments.