
Hi, there this is Mike.
I want to thank everybody who wrote in earlier this week and answered my three questions. The more I know about what you are looking for, the easier it is for me to develop the content you like and can use.
We plan to double down on the things you like while improving some of the ways we deliver the content. Just because I’m not asking every day what you like or don’t like and what you can use or cannot use, does not mean that we’re not interested. As you find entries that are useful, please let us know. If you find things you can do without, that’s even more important for us to know.
I know some people are concerned because they’re afraid if they make a comment, they will end up on my mailing list somewhere. I’d make everybody this promise, “I will never put anyone on a mailing just because they commented on one of my blogs.”
If you would wish to be on my mailing list, please let me know. Otherwise, reading and commenting on the blog will not put you on a mailing list. This is a promise between friends, me and you.
As promised, today we are looking at a real Pareto chart. I was going to use a computer build line to show it. I thought it would be better if I used SAM and his scenario as the backdrop for this. We all know about SAM’s work.
SAM has been keeping a tick sheet with the number of each type of problem he encountered. This was before everything got fixed last week. The tick sheet looked like This:
| Problem | Occurrences | Tic marks |
| Car will not start | 6 | XXXXXX |
| Lost car keys | 10 | XXXXXXXXXX |
| Saw snakes | 2 | XX |
| Had to borrow money | 1 | X |
| House over 80° | 1 | X |
| Total | 20 |
Once SAM collected these numbers, then he could make the Pareto chart. You often hear that the Pareto chart shows where 20% of your problems cause 80% of your work
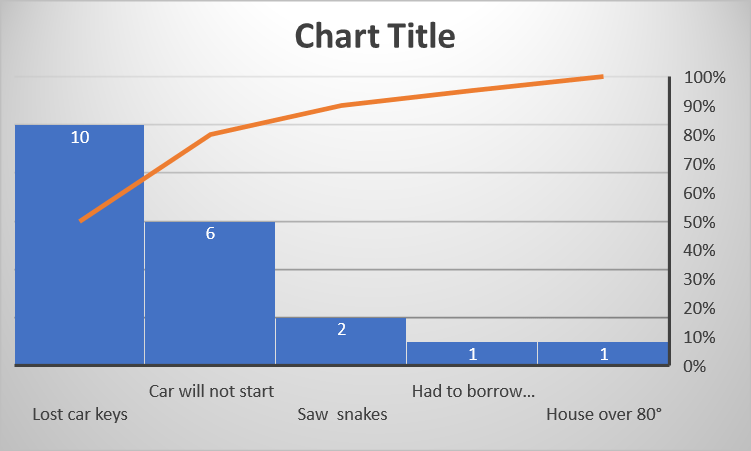
The chart shows us what to tackle first to get rid of the biggest hitters. Very small numbers are showing minutia. Minutia is a word for all those little bitty annoyances, they don’t cause the big problems and fixing them won’t fix the big problems. That’s why we use the Pareto chart so we can identify and fix the largest problems first.
Once those problems are fixed, guess what, the smaller problems have moved up to be the largest of the problems. This is presuming another unknown large problem has not shown itself yet. And once the medium and smaller problems are now our top problems, we can turn attention to those and fix those also. We don’t leave problems unfixed, we just fix them in order.
I hope this helps. Tomorrow I will have a new article, and next week I will start a story that is told in graphics and pictures.
Have a great day.
